The seven-step assessment of soil health
To ensure robust soil health monitoring and to be able to detect any negative trends or changes on time, it is important to get the right framework. In the EcoStac.AI we use the seven-step assessment of soil health:
1. Assess the history of a site
last 30+ years based on the Landsat-derived indices and find out e.g. how much soil organic carbon (SOC) has been gained/lost over the last 30 years?
2. Determine the current state of soil
What is the current state of physical and chemical soil properties?
3. Determine soil potential (next ten, 20, 30 years)
What is the SOC sequestration potential of this soil? What is the agricultural potential of this soil?
4. Collect extra soil samples, send them to the lab
Generate a sampling design that helps increase mapping accuracy. Optimize the number of samples while taking into account the costs of sampling.
5. Import new local data, then re-analyze and reassess steps 1, 2, and 3
Import new local samples/results and add them to the training points. Re-assess local prediction accuracy.
6. Suggest concrete site-specific Key Performance Indicators (per farm/land unit)
Provide concrete measures to help increase soil health and/or provide links to documents/organizations that can help increase soil health.
7. Track progress per farm and re-assess if required
Every one to two years, update the indicators. Compare with the planned transition in #6. If necessary, recommend re-assessment.
Terabytes of Data currently available in the App
R&D Projects currently basis for developing the EcoStac.AI
Hours Of Production Work took us to make this App
Data scientists and back-end front-end developers behind the App


Services
EcoStac.AI provides a variety of services from automated report generation (certification), automated generation of sampling designs (uncertainty driven), automated re-analysis and model fitting. We have a proven record of producing geospatial data (soil agronomy data cubes) for USA, Africa, Europe and the world. We are currently producing terabytes of data to help track primary productivity and detect potential negative trends.
Automated report generation
Produce reports for your farm with a click-of-button. Looking for soil carbon certification? We can help generate the detailed report using most comprehensive spatiotemporal Machine Learning.
Automated sampling designs
Sampling designs based on Feature Space Coverage Sampling (FSCS), but also uncertainty-based sampling aiming at drastically minimizing sampling costs.
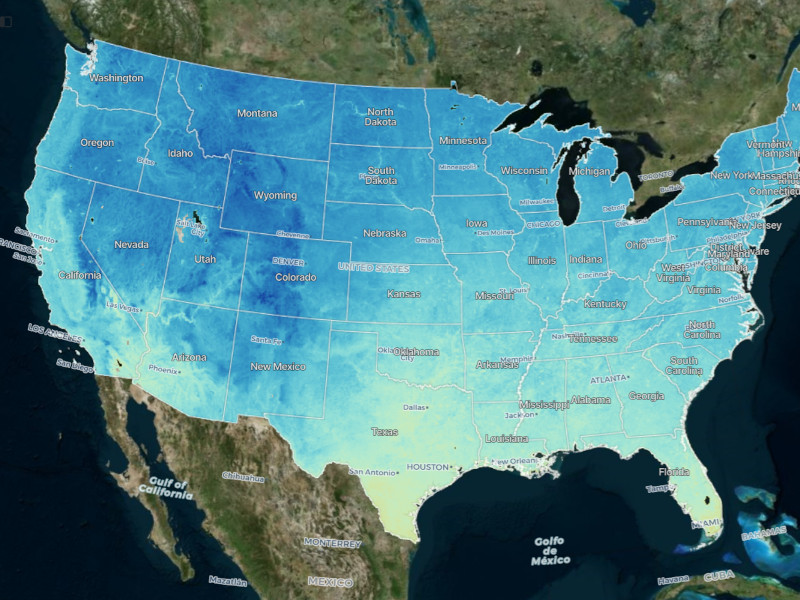
Optimized large-scale data cubes
We are aiming at producing global consistent and complete data for the whole land mask. Currently we have enough EO data for the conterminous USA, and pan-Europe; other continents will be mapped in the years to come.
Integration with basic layers
We provide at one place various national-scale and regional-scale agronomy information including climatic data, pesticides & herbicides inputs, above and below-ground biomass. Currently the focus on the last 25+ years annual and monthly values.
Robust API
API services are available for advanced users. These can be integrated into B2B solutions or similar.
Certification
Looking for soil carbon sequestration credits? Notice: this service is currently not available but will be added in the next release of the app.
Why EcoStac.AI?
EcoStac.AI provides the cutting-edge data and technology for tracking your farms from sky. But we go beyond just serving your some archive EO images: our missions is to become doctors for your land and help you prevent from your land and soil ever getting degraded or unhealthy.
A robust framework for soil health assessment
It will take time until we connect with you and collect new samples, but once we connect global, regional and local data, we will be able to track the Key Performance Indicators for your farm and gradually provide predictions for the coming 10+ years.
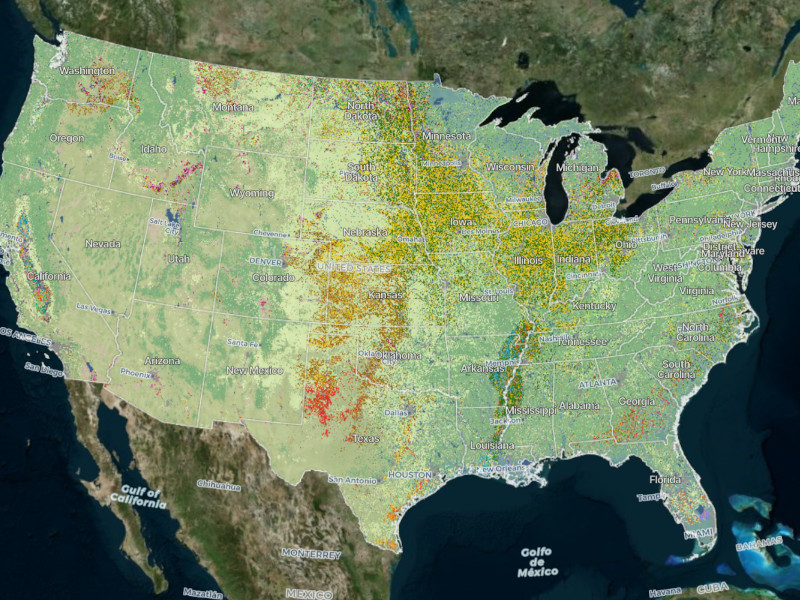
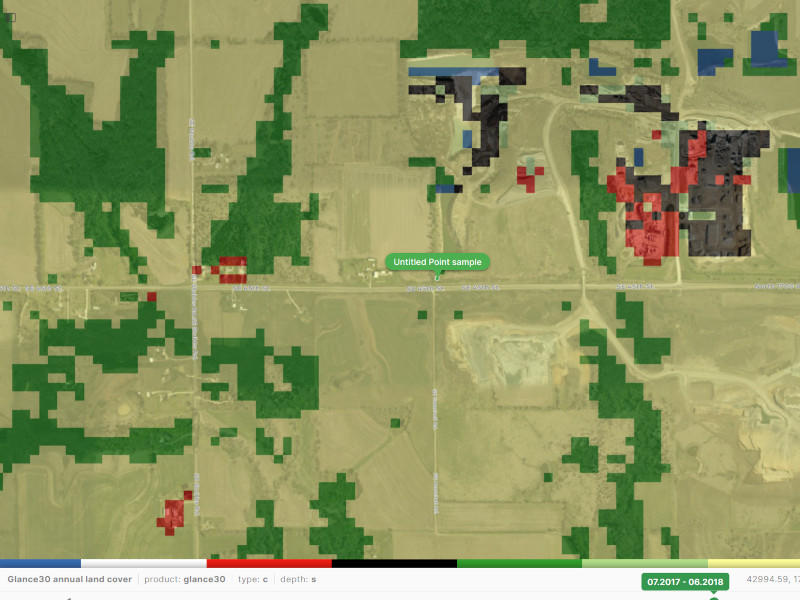
High spatial resolution / covering 2000–2022+
Thanks to the combination of Landsat ARD images and Sentinel-2 10 m resolution images we can predict soil organic carbon, above and below ground biomass at unprecedented spatial resolution. The 10 m resolution data allows for precise decisions matching precision Ag projects.
Coming from the leaders in geospatial data production
We have a proven record of producing geospatial data (soil agronomy data cubes) for USA, Africa, Europe and the world. We are currently producing terabytes of data to help tracking primary productivity and detect potential negative trends (possible land degradation processes).
Products
We currently providing terabytes of time-series layers for 2000–2022+ at high spatial resolution (30 m; aiming at 10 m resolution for the years 2018+) all as Cloud-Optimized GeoTIFFs hence also fast and robust access via our API. Most of data in the EcoStac.AI is in fact open data and can be accessed and downloaded via our STAC catalog. Only the certified predictions of Key Performance Indicators (soil carbon stocks, soil pH) and similar are proprietary data as it is used for report generation.
- All
- Soil
- Land cover
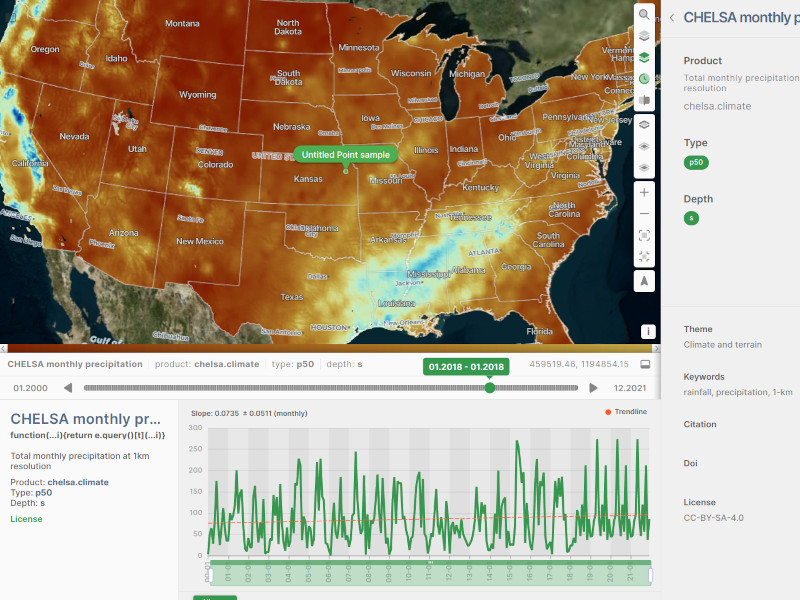
- Climate
Team
This App was made possible thanks to a highly qualified team of data scientists, soil scientists, EO data experts, front-end and back-end developers.

Tom Hengl
Technical Director at EnvirometriX
Ichsani Wheeler
Product Manager
Leandro Parente
Computing Center technical lead
MultiOne
DevelopersFrequently Asked Questions
Based on your feedback, we are planning to improve the App and functionality. Because you opinion matters and there is no time to loose to boost health of our soils.
-
How were the soil carbon stock maps produced?
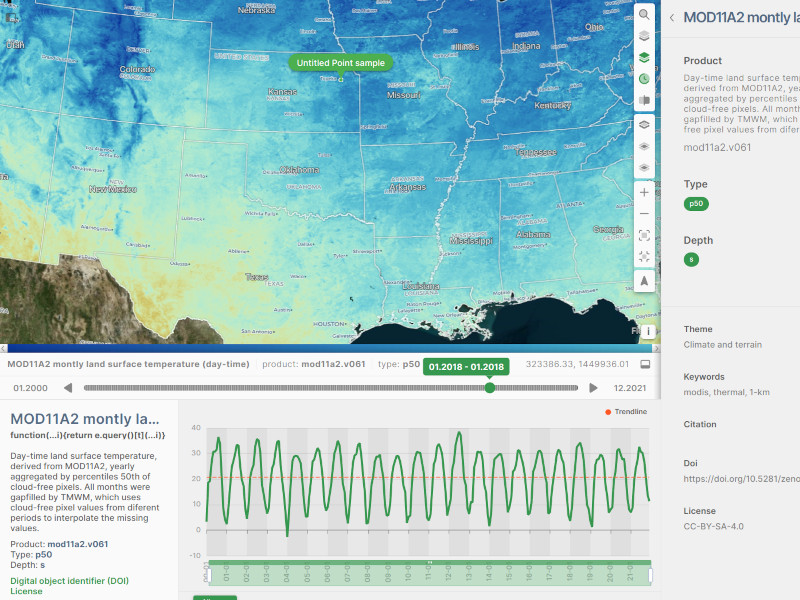
The predictions of soil stocks (t/ha) are based on the USDA and USGS soil laboratory data fully documented in the Open Soil Spectral Library and OpenGeoHub’s compilation of soil observations and measurements. Additional layers include Landsat bimonthly and annual biophysical indices, Cropscape, USGS’s National Land Cover and similar open data products produced primarily by the Federal government institutions. We generate predictions using spatiotemporal Machine Learning. It is important to note that all predictions are based on a single model, hence predictions for all years are consistent and based on all soil laboratory data.
-
How do I generate report for my farm?
If you login to the app and then select "Collections and Farms" button on the left, you will be able to zoom in and digitize your farm directly using the Very High Resolution images. The reports for your farm can then be automatically generated using "Generate report". For more advanced functionality, you need to register for the App.
-
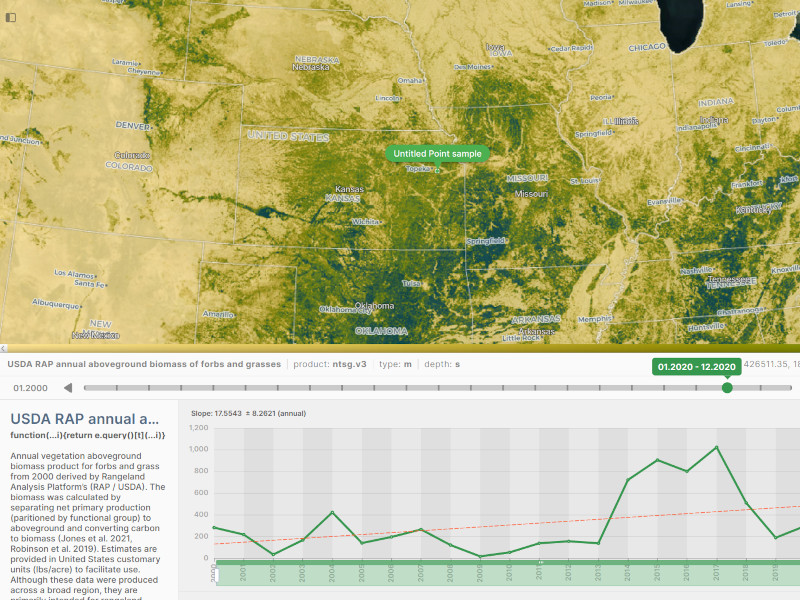
What do the trend maps mean? Why does my farm shows negative trends?
The trends per variables (e.g. soil organic carbon stock, NDVI) are generate per pixel or per farm based on time-series data. Negative trend means that you are potentially loosing soil organic carbon or primary productivity of your land. But you need to carefully look at beta-1 coefficient it could be negative but with a gentle slope. Note also that these predictions are at some places significantly uncertain (wide prediction errors) hence the actual gains or losses need to be validated with ground observations.
-
How can I download or open data in my local GIS?
By using the stac.ecostac.ai you can open majority of layers listed in QGIS or similar. Simply copy the URL and then add the layer from URL. This way you will not have to download the whole maps, not to mention all layers (>12TB in size).
-
How do I find out what is the SOC sequestration potential of my land?
We are working on an API that can generate predictions of soil carbon sequestration potential. This will be made available in the next version. For start, if your farm has possibly lost soil organic carbon in the last 25+ years, the soil carbon sequestration potential is at least the amount you have lost.
Contact
Important note: the EcoStac.AI app and functionality are still under construction. Use at own risk. We are improving the data and functionality every day. For a demo or potential larger-size contract, please contact us using details below.